Water flows from higher grounds to lower grounds.
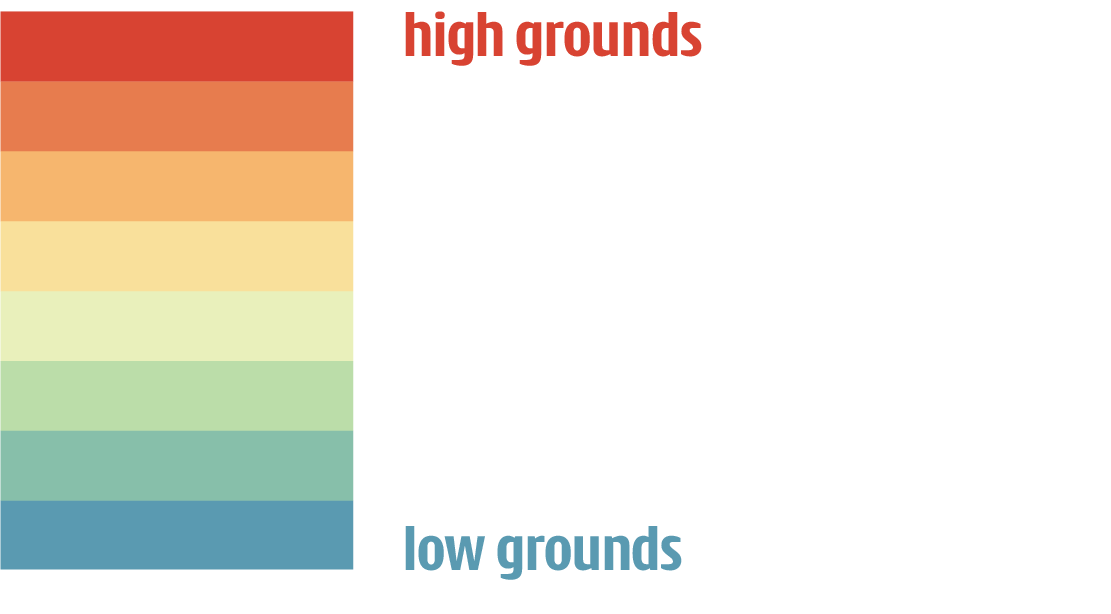
The gradient map is the DEM (Digital elevation model) of Bangalore which represents the terrain of
the city.
Red represents the higher grounds and blue represents the lower grounds.
The city lies within two sub basins of the Indian subcontinent: the Cauvery Basin and the Ponnaiyar
Basin.
The city has 5 major catchment valleys, divided by the ridge line:
1. Hebbal Nagavara Valley
2. Koramangala Challaghatta Valley
3. Vrishabhavati Valley
4. Suvarnamukhi Valley
5. Arkavathi Valley
Trace the flow of water from Bengaluru to the Bay of Bengal:
Select a valley to view its details.
EXISTING TANKS
175
Lost Tanks
146
Total Count
321
Sitting at 900m above sea level with no perennial rivers, Bangalore has relied on man-made tanks and other water-bodies as its primary water source since the city's establishment in the 16th century.
Categories of waterbodies identified in the city over the last few centuries:
- Kere: Man-made tanks larger than 3 acres. Historically built as irrigation tanks.
- Gokatte: small ponds used by cows for bathing and drinking.
-
Kunte: seasonal, small ponds used for domestic activities and recharging rainwater. Often
between 1-3 acres.
- Kalyani: stepped tanks
Head to the Filter & Find Section to explore the categories of waterbodies further.
Over the last 4 centuries, these waterbodies have been built over - they have reduced in size with most of them disappearing completely. We have identified 108 lost lakes of Bengaluru from historic maps and traced them from Historical maps of 1790, 1870, 1896 and 1969.
Explore the loss of water-bodies over time:
Lost Tanks Identified by:
Historically, water used to travel from tank to tank through naturally formed low-lying stormwater
streams - forming a cascading water-system. Most of these streams have been converted into
concretised storm-water drains, locally known as 'Rajakaluves'.
Over time, some of these drains have been built over and disconnected from the cascading system. The
map shows the existing rajkaluves. The image below is typically how primary drains with retaining
walls look like around you.
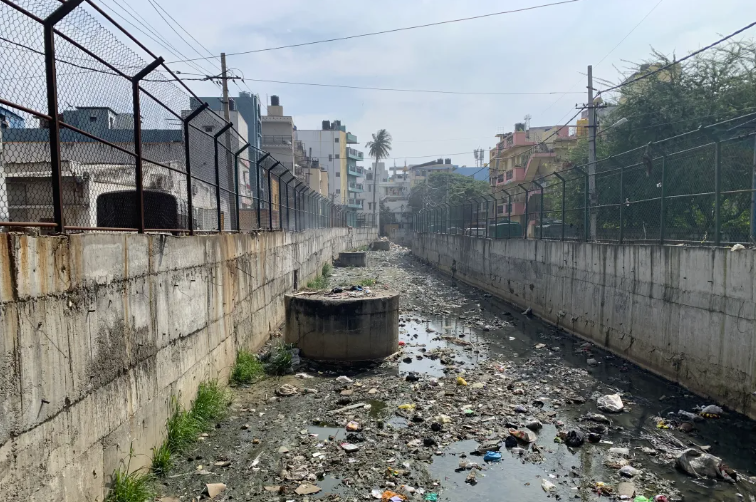
Click on the drains for more information.
The secondary drains carry runoff, from road-side drains and tertiary networks, to the primary drains.
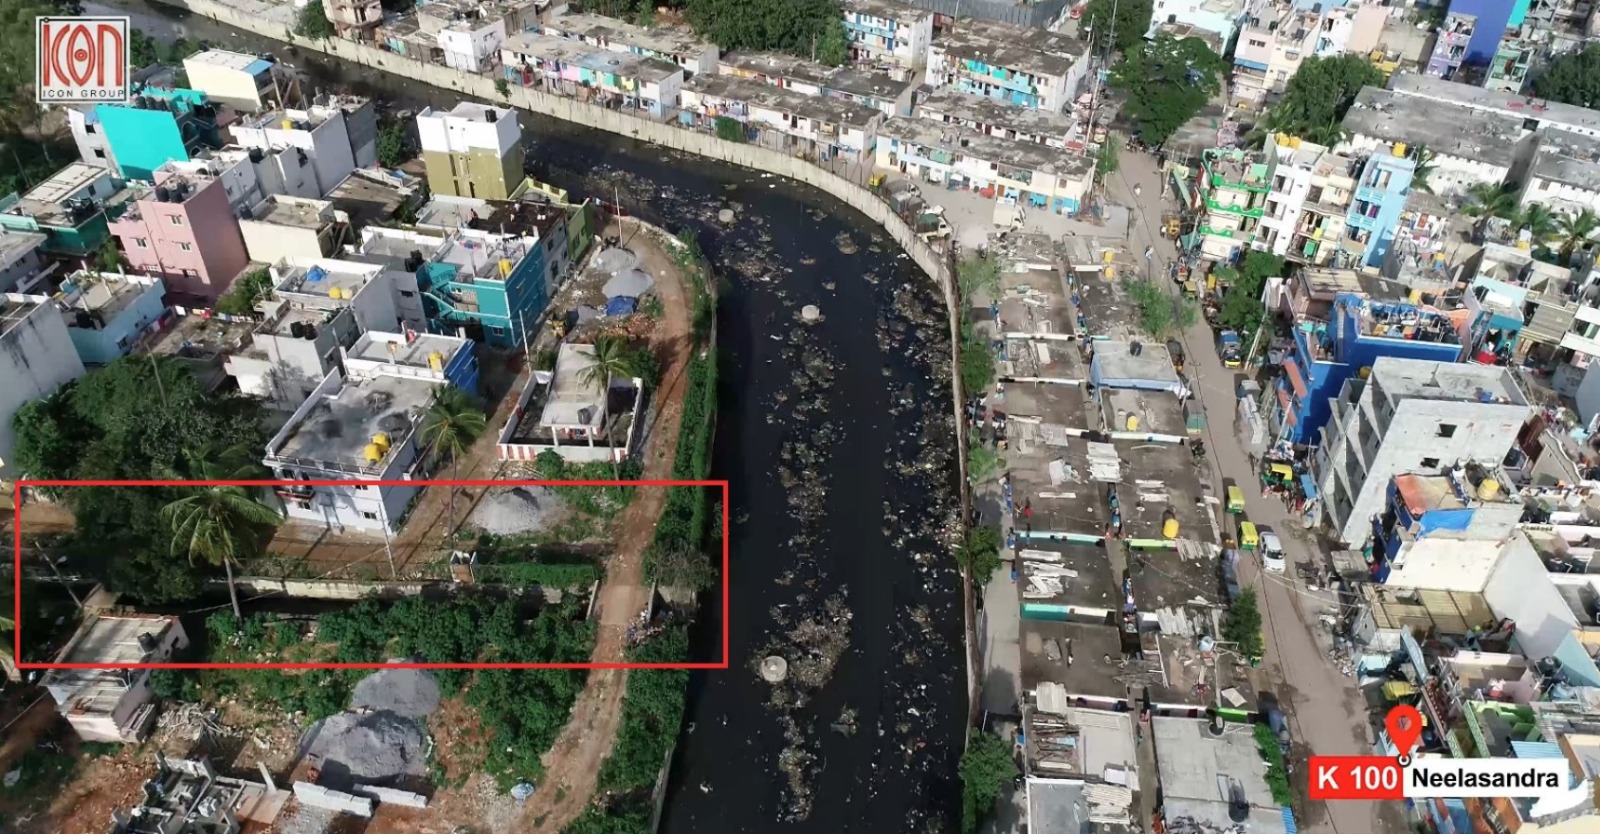
The image above shows a typical condition of secondary drains connecting to primary drains. These drains link tanks and eventually flow into rivers, forming the city's cascading stormwater system.
Notice how flood-prone zones overlap with lost lakes and constricted drains!
Encroachments have narrowed drains over the years, while tanks and marshes have been built over completely. This has blocked the city's natural drainage pathways.
Now, these vulnerable low-lying areas experience severe waterlogging and flooding during heavy rains. The map shows flood-prone locations as recorded by KSRAC in 2023.
Source: Open City
Filter by:
Filter the Water-bodies by:
Filter the Drains by:
Filter by:
Click on a typology feature to see LHS and RHS values
| Drain ID: — | |
|
LHS
—
Select to view
|
RHS
—
Select to view
|
Typology Legend
Scroll down to visit the typology library
Upload your own GeoJSON or KML files to overlay on the map. Maximum 5 layers allowed.
Supports Point, LineString, and Polygon geometries.
Drag & drop your GeoJSON or KML file here
or click to browse
Read this file before downloading and using any of the following layers.
| Layer | Source | Link |
|---|
GIS DISCLAIMER While every effort has been made to ensure the accuracy of this information, Mod Foundation makes no warranty, expressed or implied, as to its absolute accuracy. This product is for informational purposes and is not suitable for legal, engineering, or surveying purposes. It does not represent an on-the-ground survey and represents only approximate relative locations. This is an open-source dashboard. All files and code are publicly accessible through our git-hub repository : mod-foundation